Tell Compelling Stories &
Grow Our Business
Turn numbers into stories that influence decisions.
We help teams see progress and share it with impact.
Who is this for
For businesses
We help visualize performance to show progress, alignment, and growth clarity.
For teams
We highlight changing priorities through visuals that track outcomes and reveal trends.
For decision-makers
We transform insights into data-rich stories that sharpen communication and direction.
We Offer De-Cluttered, Meaningful Business Narratives
We sync up dashboards, reporting, and analysis. So, teams can respond faster, measure impact accurately, and share outcomes with confidence.
Real-time Dashboard Development
Decision-making stalls when data arrives too late. We build real-time dashboards that capture live activity. Leaders gain instant visibility to act at the right moment.
Data Visualization & Storytelling That Makes Information Speak
Transform scattered data into visuals that dictate understanding, strengthen insight, and guide confident business decisions.
Simplify complex information
We design visual systems that translate massive datasets into insights that teams can act on.
Spot patterns faster
We reveal emerging shifts so leaders can respond with precision and timing.
Communicate decisions better
We showcase visuals that keep reporting, presentations, and collaboration aligned.
Empower all levels of the organization
We help businesses move from reading numbers to grasping stories that influence smarter actions.
Delivering insights through a visual intelligence cycle
Data Collection & Structuring
We gather, organize, and prepare raw information to ensure datasets support accuracy.
Insight Modeling & Design
We frame models that represent relationships, performance, and emerging movement.
Visualization & Refinement
We offer dashboards and visuals, refining layouts and hierarchies for interpretation at a glance.
Tracking & Reporting
We monitor patterns over time, updating visuals so decisions remain informed and responsive.
Predict and Act On What’s Next Before It Happens
We translate complex signals into guidance that drives decisions. We ensure that prediction sharpens focus, reduces uncertainty, and uncovers growth potential.
BFSI
Analytics strengthens financial stability. We outline compliance posture, spending trends, and risk signals to refine strategic control.
Capital Markets
Foresight sharpens market agility. We assess trading behavior, liquidity flow, and investor confidence to reinforce capital strength.
TMT(Telecom, Media & Technology)
Data enhances understanding. We examine engagement depth, bandwidth efficiency, and tech performance.
Manufacturing
Structure improves production flow. We study material movement, resource alignment, and quality balance to steady manufacturing output.
Aerospace
Engineering ensures reliability. We evaluate prototype performance, design thresholds, and test accuracy to uphold aerospace standards.
Aviation
Coordination sustains flight operations. We analyze scheduling data, maintenance patterns, and performance metrics to optimize aviation outcomes.
Automotive
Automation refines assembly accuracy. We review system diagnostics, component timing, and performance ratios to elevate automotive processes.
Telecommunications
Connectivity advances telecom performance. We track usage density, network load, and service patterns to maintain communication consistency.
Transportation
Logistics strengthens transport efficiency. We examine route planning, capacity use, and timing precision to streamline transit systems.
Defence
Strategy reinforces defense capability. We monitor mission data, asset endurance, and tactical response to improve operational readiness.
Healthcare
Insight enhances patient outcomes. We organize clinical records, diagnostic trends, and treatment timelines to improve healthcare delivery.
Research and Development
Optimization drives product evolution. Our algorithms study usage data, churn factors, and adoption metrics to boost innovation.
How Our Data Storytelling Has Helped
Our projects start with purpose and end with proof. We focus on progress that lasts and traction that doesn’t stop.

Vembur Power
Renewable Energy – IoT Analytics Platform
THE CHALLENGE
No real-time visibility across thousands of smart meters, limited analytics for operational and business decisions, and no proactive mechanism to detect inefficiencies or device failures across large-scale solar operations.
OUR SOLUTION
Implemented a complete IoT analytics architecture with real-time MQTT → InfluxDB ingestion, built KPI-driven dashboards for load efficiency and device health, added automated alerts and anomaly detection, deployed secure VPC-only access, and enabled long-term stability with backups and performance tuning.
More Success Stories
Unified Fleet & Cargo Intelligence Platform for Real-Time Vessel Operations Visibility
CHALLENGE:
Manual Excel uploads, inconsistent vessel updates, and no real-time visibility across fleet, port, or cargo activity.
RESULTS:
- 60–70% reduction in manual reconciliation
- Real-time fleet, port, and cargo visibility
- Faster detection of delays and underutilized vessels
- Improved client experience with professional dashboards
Unified Operations & Fulfillment Intelligence Platform for End-to-End Workflow Visibility
CHALLENGE:
Fragmented Excel-based workflow with no unified visibility across enquiry, sourcing, production, QC, delivery, or payments.
RESULTS:
- 75% reduction in manual Excel consolidation
- Faster detection of delays and fulfillment gaps
- Improved vendor accountability and SLA tracking
- Clear visibility into pipeline, margins, and operational health
ProdBrew empowers you with insights built for a sharper understanding – see how
We translate complex metrics into visual narratives that expose what drives change. Each view simplifies exploration, strengthens focus, and fuels smarter momentum.
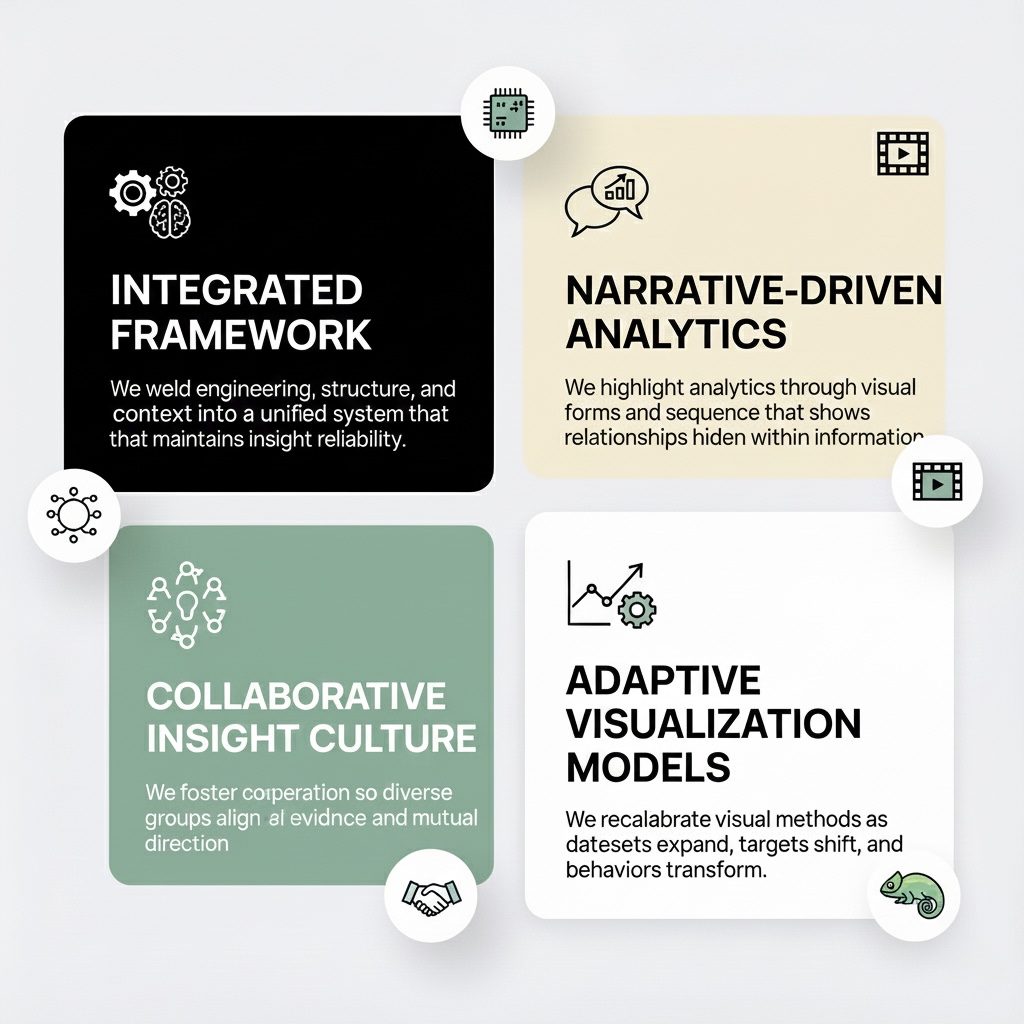
Integrated intelligence framework
We weld engineering, structure, and context into a unified system that maintains insight reliability.
Narrative-driven analytics
Collaborative insight culture
Adaptive visualization models
Decision-focused design
When stories lead the numbers, impact is inevitable — here’s what clients achieved through visualization
- Reporting cycles shortened by 61% after interactive dashboards replaced static reports
- Cross-team collaboration increased 4.8x once insights were shared through unified visuals
- Forecast accuracy improved by 46% through continuous trend tracking and live data views
- Communication efficiency rose by 57% as visuals standardized performance language
- Decision confidence strengthened by 63% when visual analytics exposed hidden relationships in data

FAQs
Get answers to the most frequently asked questions.
What is data visualization, and why is it important?
How can data storytelling benefit my business?
Who can benefit from data visualization services?
How does the process of data visualization work?
What industries do you serve?
Can data visualization help improve business decisions?
How do you ensure insights are accurate and reliable?
Let your data speak in ways promises never could!
“Very pleased with the results from the ProdBrew team. We will continue building with them in the future. Highly recommend!”Chris Riley, Owner, Acme Studio
“ProdBrew has become my go-to team for both MVPs and complex builds. Their detailed questions and smart pushback help avoid feature creep, making them a reliable long-term product partner.”Sundar Ganesan, Business Head, Caratlane
“The ProdBrew team has been excellent to work with—always a step ahead in development and quick to respond. Their post-launch support is exceptional, and we're excited to keep building more great things together.”Andreas Papadopoulos, Administration